
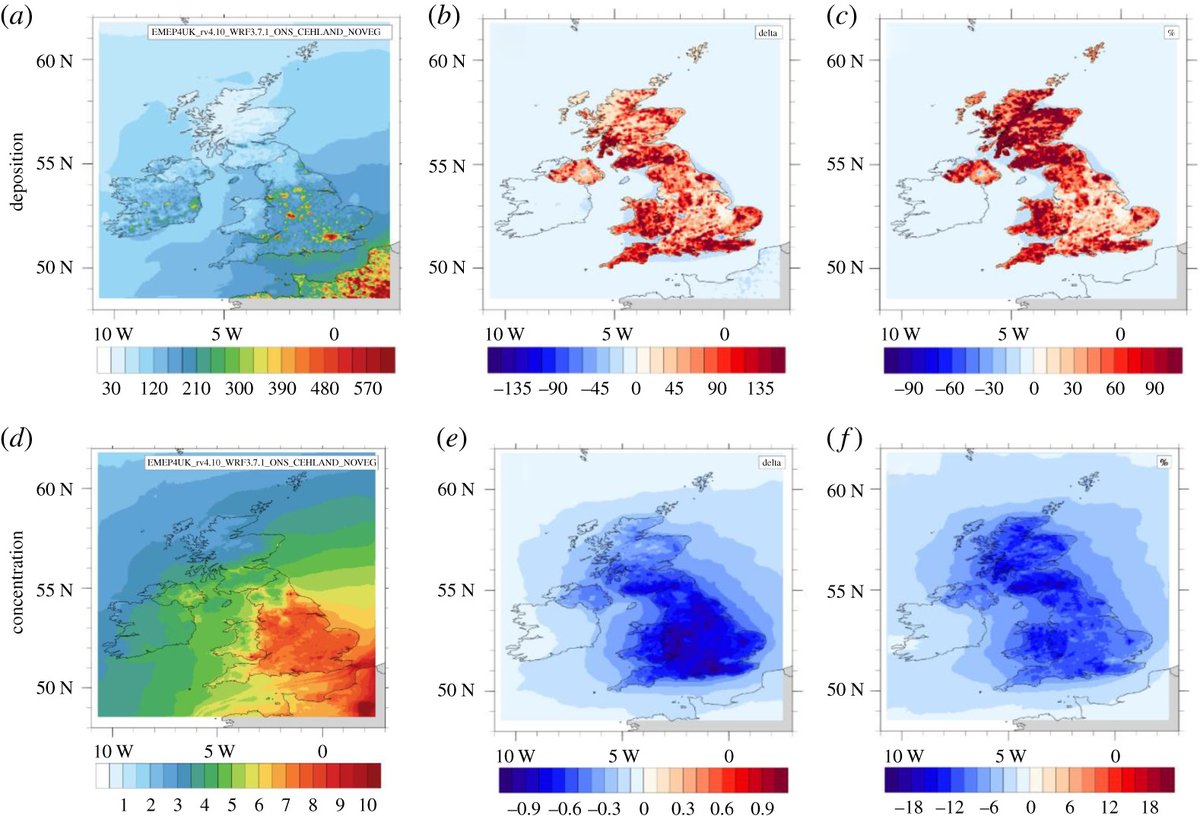
Figure 1. Model simulations for PM2.5 for 2015, showing (a) the annual total PM2.5 dry deposition to a vegetation-less UK (NoVEG) (mg m−2), together with the (b) absolute (mg m−2) and (c) relative (%) changes in deposition caused by the vegetation (UKBASE-NoVEG), with positive (red) values indicating an increase in deposition to vegetation compared with no vegetation. (d) The annual average PM2.5 surface concentration for a vegetation-less UK (µg m−3), together with its (e) absolute and (f) relative change due to vegetation (UKBASE-NoVEG), with negative (blue) values indicating a decrease in concentration above vegetation compared with no vegetation. The dust component is not included in these figures (see text).
Name of author
author@email.co.uk
Give feedback
Please take a moment to complete a brief survey